
Given the urgency of climate change, the integration of climate projections and indicators has become imperative for sustainable agricultural planning. Europe, with its diverse climatic regions and intricate agricultural landscape, is a representative study area for this purpose. Accordingly, this study presents a methodology for downscaling and representing the most relevant indicators and projections for agricultural planning across Europe. Based on a detailed literature review, several indicators were retained ranging from the impact of temperature fluctuations on crop yields to anticipating shifts in precipitation patterns affecting water management strategies, and beyond for tapping into the intersection of climate science and agricultural resilience. This aspect is one of the pillars of the AgriDataValue project and ambition. Accordingly, using the CMIP6 model outputs, projections of the following climate indicators for the years 2030-2050-2070 under the SSP2-4.5, and SSP5-8.5 scenarios will be performed:
- Air temperature,
- Capacity of soil to store water
- Daily maximum near-surface air temperature
- Daily minimum near-surface air temperature
- Evapotranspiration including sublimation and transpiration
- Moisture in upper portion of soil column
- Near-surface air temperature
- Near-surface relative humidity
- Precipitation
- Snowfall flux
- Cold spells duration
- Number of frost days (Tmin < 0°C)
- Number of ice days (Tmax < 0°C)
- Number of hot days (T > 35°C)
- Number of very hot days (T > 45°C)
- Number of consecutive dry days
- Drought frequency and severity
- Number of days with precipitation above 20 mm
- Number of days with precipitation above 50 mm
- Growing season length
- Average largest 1-day and 5-day precipitation
- Floods
- Landslides
The Coupled Model Intercomparison Project Phase 6 (CMIP6) is a collaborative international effort involving climate modeling groups worldwide. CMIP6 aims to improve our understanding of climate processes, project future climate scenarios, and provide a basis for assessing the potential impacts of climate change. It involves a suite of global climate models contributed by different research institutions and organizations. These models simulate various components of the Earth’s climate system, including the atmosphere, oceans, land surface, and sea ice. The CMIP6 models are used to generate future climate projections under different greenhouse gas emission scenarios, providing crucial information for climate research, policymaking, and adaptation planning.
Under CMIP6, The Shared Socioeconomic Pathways (SSPs) are scenarios developed to represent different possible future trajectories of society, demographics, and economics. They are used in conjunction with Representative Concentration Pathways (RCPs) to explore a range of climate futures. Two specific SSPs mentioned and used in this study are SSP2-4.5 and SSP5-8.5:
SSP2-4.5 (Medium Challenges and Mitigation): This scenario represents a future where global society faces moderate challenges in terms of sustainability and environmental issues. It assumes that, through a combination of technological advances, policy efforts, and societal changes, there is a successful mitigation of greenhouse gas emissions. The radiative forcing associated with this scenario is approximately 4.5 Watts per square meter by the year 2100.
SSP5-8.5 (High Challenges and Limited Mitigation): This scenario portrays a future where global society faces high challenges and experiences limited mitigation efforts. It envisions a trajectory where economic and population growth continues without substantial efforts to curb greenhouse gas emissions. As a result, radiative forcing is projected to reach approximately 8.5 Watts per square meter by the end of the century, indicating a high level of warming and associated climate impacts.
As SSP2-4.5 is considered as the intermediate and most plausible, it was chosen as the first scenario for this study. However, according to recent studies, the world is almost at the limit, if not already exceeded SSP2-4.5 and is heading for the pessimistic SSP5-8.5 trajectory. Accordingly, to be sure that we cover the whole range of possible climatic scenarios, SSP5-8.5 was added to the study. The logic behind this inclusion is that by preparing for the worst (i.e., SSP5-8.5), solutions for intermediate scenario will surely be included. Therefore, the SSP2-4.5-SSP5-8.5 ranges were chosen for the study.
2. Methodology
In this section, the sequential methodology for building the climate indicators is explained:
Step 1: Collection and review of relevant data and material
While open-access databases and global climatic models can be considered as potent inputs for agroclimatic risk assessments, their resolution, even after downscaling, presents certain challenges. At each downscaling step, several assumptions are made. These assumptions are often associated with uncertainties that will ultimately affect the quality of the final output. Therefore, calibration with observed data is often needed to ensure the validity of the approach and the integrity of the simulated results. The CMIP6 (Coupled Model Intercomparison Project Phase 6) model is the most used platform for current climate modeling, characterized by its refined parameterizations and improved representation of Earth system processes. Its integration of complex climate components, including atmosphere, ocean, land surface, and cryosphere, facilitates high-resolution simulations for detailed agroclimatic assessments. In the realm of agricultural studies, CMIP6 outputs serve as valuable resources for quantifying future climate scenarios and their impacts on agricultural productivity. Through its multi-model ensemble approach, CMIP6 enables the evaluation of uncertainty and variability in projected climatic trends, thus enhancing the reliability of agricultural planning efforts. By simulating key agroclimatic variables such as temperature, precipitation, and soil moisture dynamics, CMIP6 helps anticipating potential shifts in crop suitability, growing seasons, and water availability critical for informed decision-making within agricultural sectors. Consequently, the utilization of CMIP6 model outputs stands as a fundamental asset in fostering adaptive strategies aimed at mitigating climate risks and bolstering agricultural resilience in the face of evolving climatic conditions. CMIP6 data was obtained from the COPERNICUS Climate Data Store (CMIP6 climate projections (copernicus.eu)) and from the World Bank Climate Change Knowledge Portal (Data Catalog | Climate Change Knowledge Portal (worldbank.org))
Step 2: Downscaling and correction of climate models
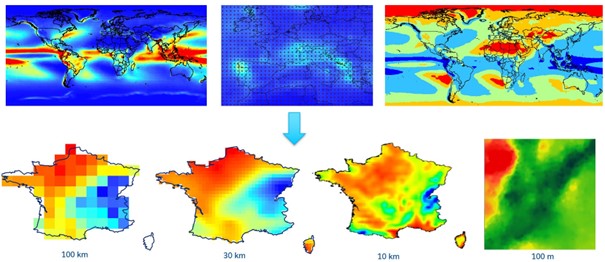
Data is obtained in NetCDF format from both data sources. NetCDFs were then rasterized to be downscaled from 100 km to 1 km. By transposing NetCDFs to raster and then points, the gridded network can be assimilated to a virtual weather station network. Since the different points contain different climatic values, these can be considered as “spatial weather stations”. Through a specific kriging technique using semi variograms, spatiotemporal variations will be revealed. An example is provided below for extreme precipitations in France (Figure 1).
Step 3: Data analysis, exposure methodology, GIS model building
Following the establishment of the climate indicators, exposure is determined. This framework embodies the first elements of the IPCC risk analysis framework (IPCC, 2014; 2020). Exposure is defined based on the occurrence of the different agricultural covers with respect to the climate risk maps. As the studied climatic risks will show spatio-temporal gradients, different crops and livestock types will be affected at different degrees, hence the GIS-based exposure analysis based on their setting with respect to the risk at different horizons. Accordingly, a site-specific approach will be ensured, hence offering a tailored identification of challenges for planning corresponding solutions.
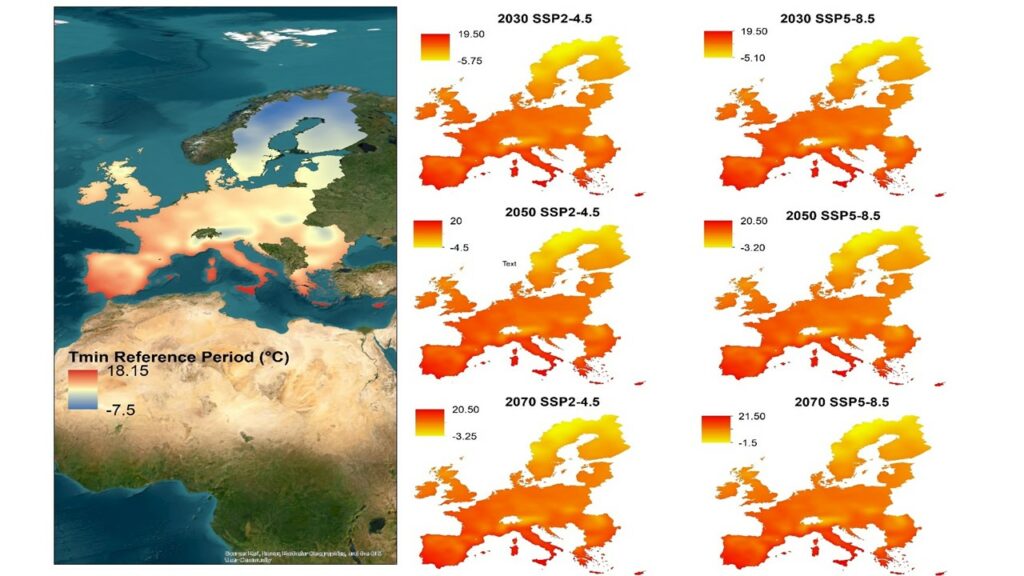
3. Results and discussionsIn Figure 2, the evolution of minimal temperatures across the different horizons and scenarios is presented. The same approach is applied to the list of indicators presented in the introduction section. As can be seen from Figure 2, an increase in minimal temperatures is observed throughout Europe.
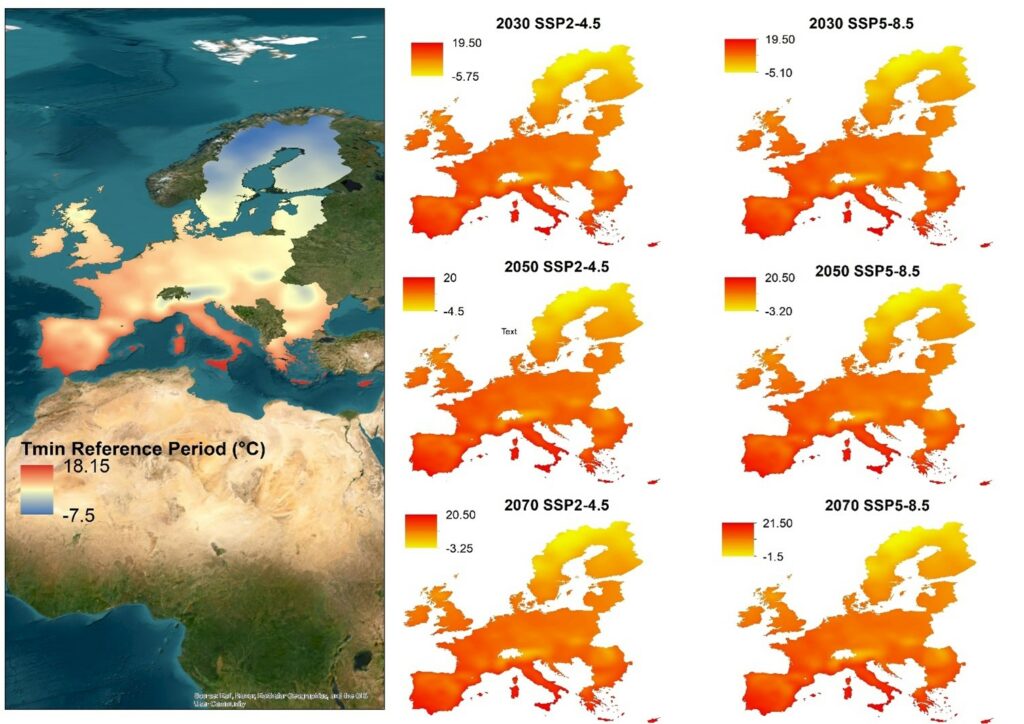
The implications of an increase in minimal temperatures in Europe could have profound effects on the agricultural sector. According to the EEA (2019)[1], changes in temperature and precipitation, as well as weather and climate extremes, are already influencing crop yields and livestock productivity in Europe. Weather and climate conditions also affect the availability of water needed for irrigation, livestock watering practices, processing of agricultural products, and transport and storage conditions. For instance, climate change is projected to reduce crop productivity in parts of southern Europe and to improve the conditions for growing crops in northern Europe. Although northern regions may experience longer growing seasons and more suitable crop conditions in future, the number of extreme events negatively affecting agriculture in Europe is projected to increase.
In southern Europe, under a high-end emission scenario, yields of non-irrigated crops like wheat, corn, and sugar beet are projected to decrease by up to 50% by 2050. This could result in a substantial drop in farm income by 2050, with large regional variations. On the other hand, in northern Europe, some of the negative productivity effects caused by climate change could be offset by longer growing seasons and more suitable crop conditions. However, most crops will suffer heavy yield damage in case of drought, frosts, or floods. Grassland is also susceptible to drought, causing cascading impacts on the livestock sector.
In conclusion, the increase in minimal temperatures in Europe could lead to a shift in agricultural practices, with potential benefits in the north being offset by significant challenges in the south. This underscores the need for effective climate change adaptation strategies in the agricultural sector across Europe.
[1] European Environment Agency. (2019). Climate change adaptation in the agriculture sector in Europe. Retrieved from https://www.eea.europa.eu/publications/cc-adaptation-agriculture