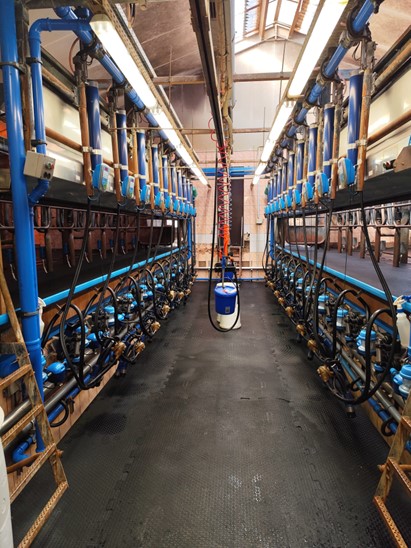
Delphy is a Dutch agricultural consultancy firm (www.delphy.nl) with a diverse clientele across various crop sectors, including open-field cultivation and greenhouse horticulture. Our reach extends beyond the Netherlands, serving clients both within and outside Europe. At Delphy, we focus on research projects, data-driven cultivation management, advisory services, and training programs. We conduct practical, field-based research and initiate global projects aimed at fostering innovation in agriculture and horticulture. Our mission is to optimize crop management through data-driven models, provide high-quality advisory services to growers, and offer specialized training for novice and experienced cultivation managers alike.
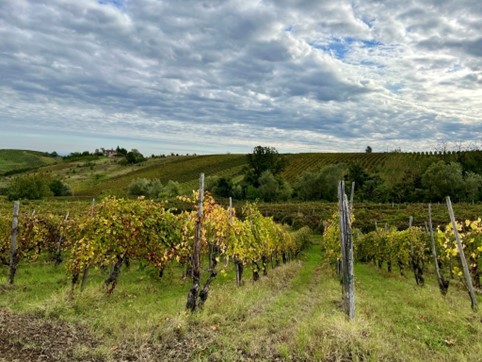
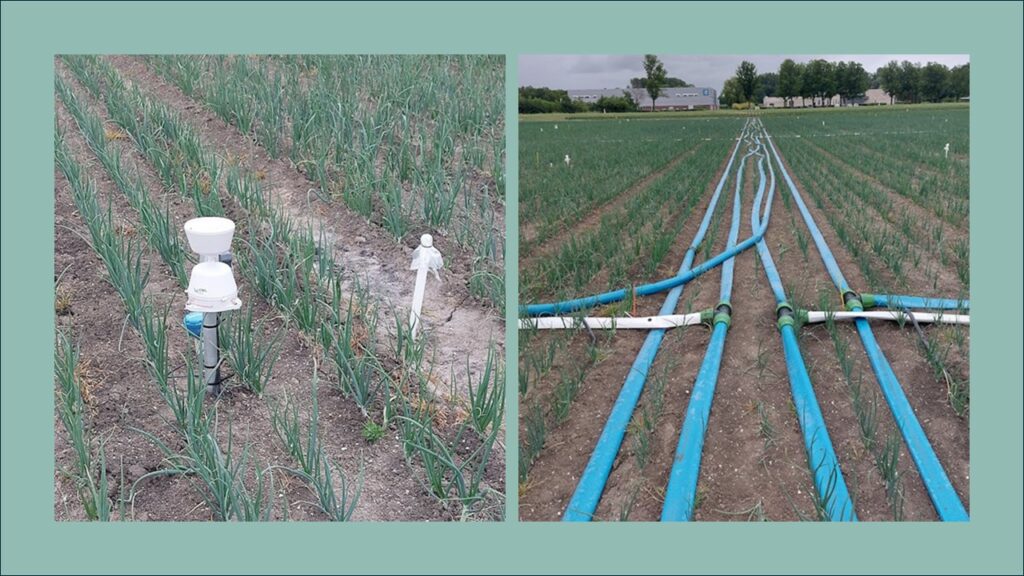
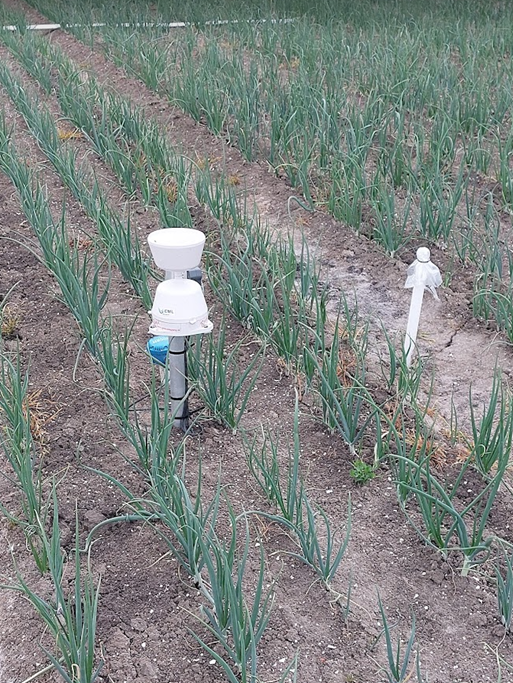
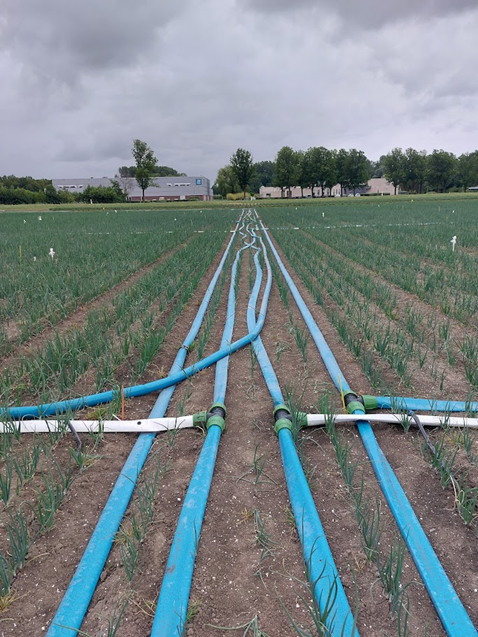
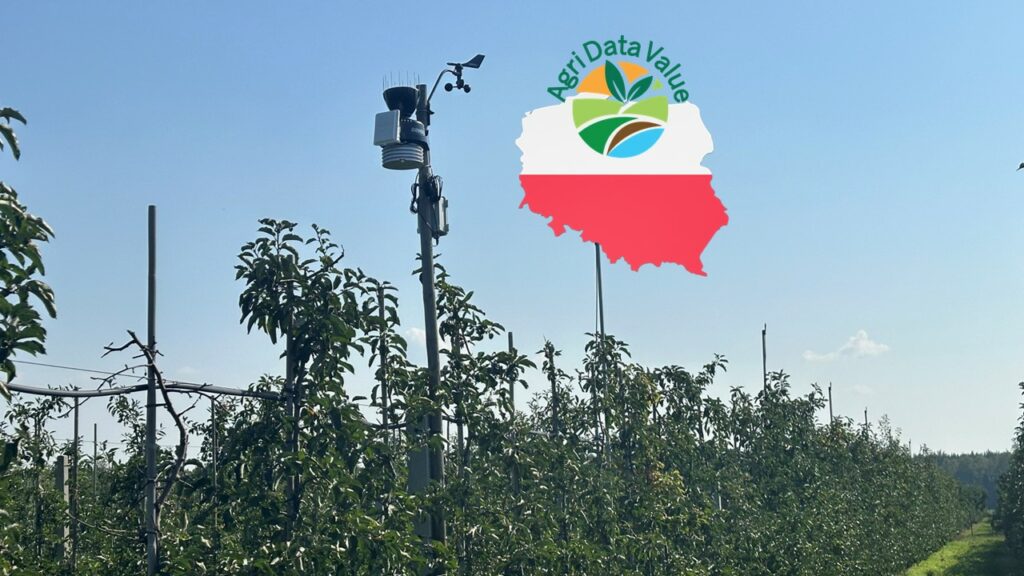
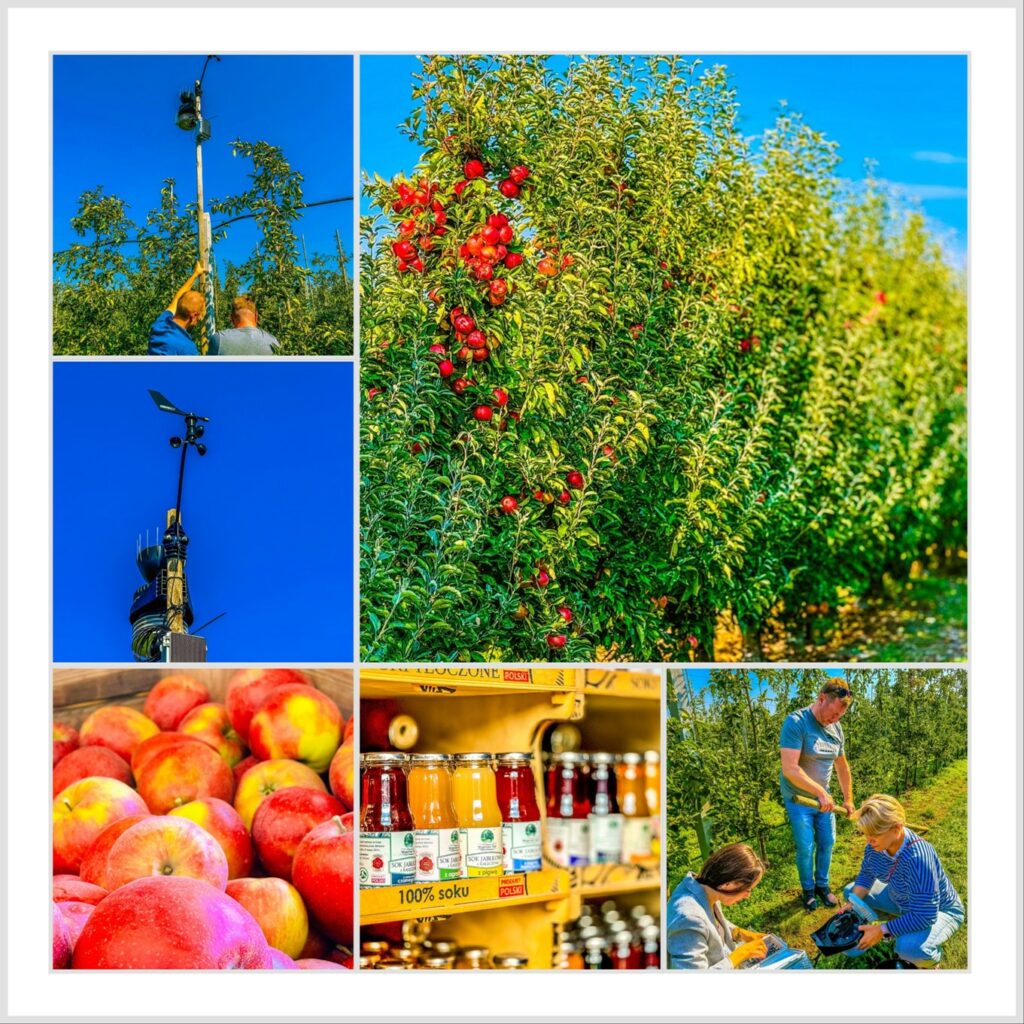
Within the AgriDataValue project, Delphy is currently running two pilots. With the infrastructure development of the AgriDataValue platform nearing completion, the focus has now shifted towards these agricultural pilots. The first pilot involves a 13-hectare plot of onions in the province of Flevoland, where a trial on drip irrigation is being conducted.
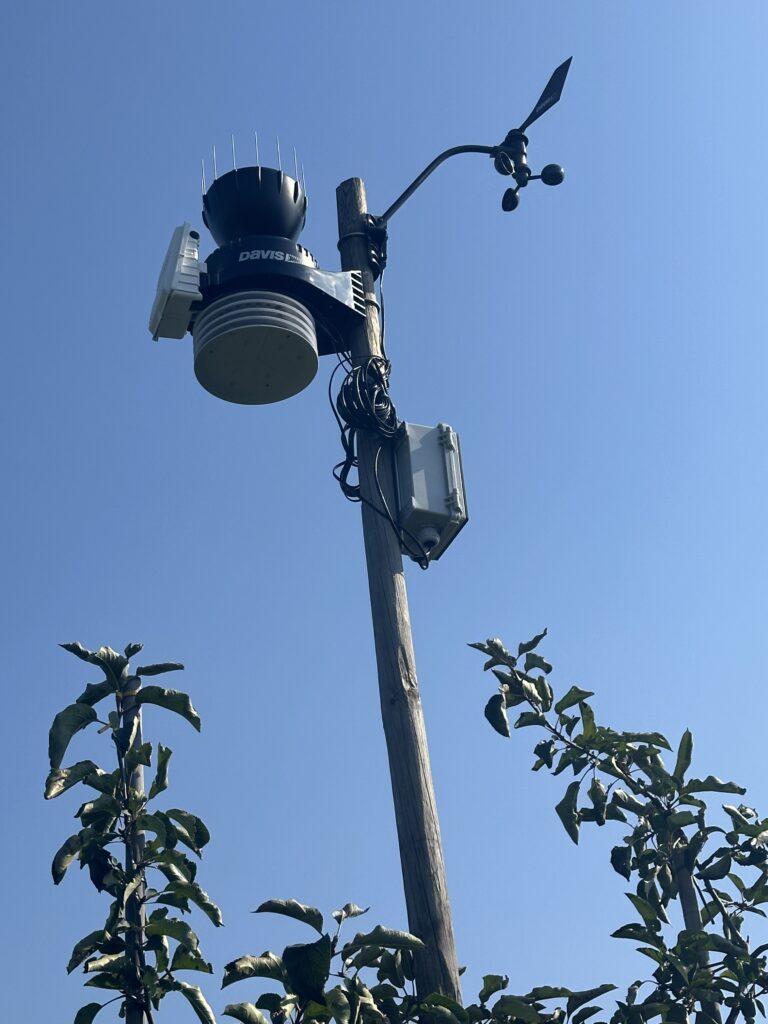
While drip irrigation has been used for years in perennial fruit crops in the Netherlands, it is only in recent years that it has been applied to annual arable crops. In this trial, Delphy is experimenting with five distinct treatments, each replicated four times. A variety of data is being collected, including measurements from soil sensors and rain gauges. Additionally, yield data from the harvest will also be analyzed. This pilot is aligned with a key use case in the AgriDataValue project: the reduction of irrigation water usage.
The goal is to share the collected data with the AgriDataValue platform and enrich this dataset with additional publicly available data, such as local weather conditions. The critical question arises: what can Artificial Intelligence (AI) and Machine Learning (ML) models do with this data? Can these technologies predict future outcomes or, even more ambitiously, eventually replace soil sensors altogether?
Soil sensors, while valuable, present several challenges. They are expensive, installation and calibration require significant attention, the connection might not always be reliable, and the accuracy of their readings can be uncertain. Moreover, determining the optimal number of sensors for reliable data is still a subject of debate. Is it ever possible to place enough sensors to get a complete picture of soil conditions?
Currently, irrigation decisions made without soil sensor data often rely on growers’ intuition. In the Netherlands, even when soil sensors are available, farmers typically interpret the data themselves and make their own decisions about if and how much to irrigate. This method poses a real risk of unnecessary water use, which is particularly concerning as access to fresh water in some parts of the country becomes increasingly scarce.
The AgriDataValue project aims to contribute to more efficient water usage, potentially eliminating the need for soil sensors in the future. We eagerly await the first results and the insights that AI and Machine Learning models might provide in optimizing irrigation practices. Could this be the breakthrough that helps farmers navigate the challenges of water scarcity in the coming years?