Tecnova will participate as an exhibitor at the international fair Infoagro Exhibition, which is held in Almeria on 21st to 23rd of May 2025, one of the key events for the intensive agriculture sector. This meeting brings together companies, technology centres and professionals from the agro-industrial field interested in the application of technologies to optimise production processes. In this context, Tecnova will take the opportunity to present the project and communicate its results.
During the event, the Tecnova team will have its own stand where it will exhibit the AgriDataValue project. A presentation is planned focused on the contribution of the project to the sustainable digitalization of the agri-food sector.
AgriDataValue aims to build a European agri-environmental data space through a distributed architecture that allows heterogeneous platforms and sensors to be integrated. Tecnova contributes by validating solutions in real environments, as is the case of the pilot located in its experimental centre in Almeria.
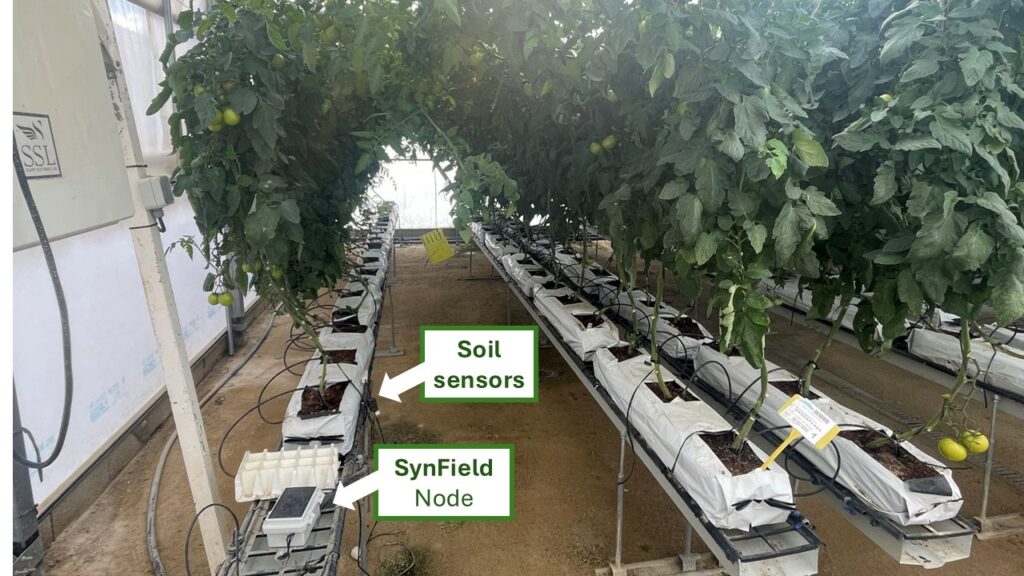
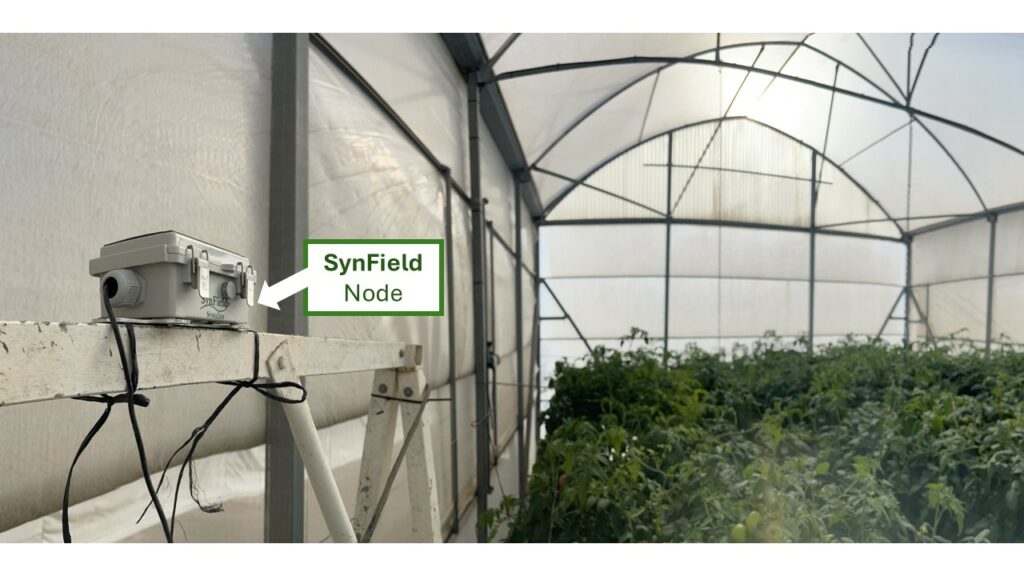
In this pilot, a SynField smart agriculture system has been installed in a greenhouse with hydroponic tomato and cucumber cultivation. This system includes a central weather station and peripheral nodes that collect real-time information on climatic (temperature, humidity, radiation, water pressure) and edaphic (humidity, temperature and soil conductivity) variables.
The data collected is visualized on an intuitive platform that allows technicians and farmers to monitor the crop environment and make informed decisions about irrigation and fertigation. The data are used within the framework of the project to train predictive models that will allow certain agronomic recommendations to be automated.
The medium-term objective is to have an agronomic management model that not only optimises the use of water resources and fertilisers but also increases the profitability of the producer and reduces the environmental impact. This approach is aligned with the objectives sought in AgriDataValue and to which Tecnova actively contributes.
With this action, Tecnova reinforces its commitment to applied innovation and technology transfer, showing at Infoagro how AgriDataValue contributes to digitally transforming the European agri-food sector.
The European farming community continues to grapple with a longstanding and formidable challenge: pest infestation. From sprawling maize fields in Spain to the apple orchards of Eastern Europe and the rice paddies of Italy, pests are responsible for substantial agricultural losses annually. According to the European Commission, pests and diseases can reduce crop yields by up to 40%, resulting in billions of euros in economic losses, increased dependency on chemical pesticides, and declining biodiversity. In this context, innovative, data-driven approaches to pest management are not just a necessity—they are a lifeline.
Addressing this pressing issue, the Multimedia and Vision Research Group at Queen Mary University of London has developed a pioneering pest classification model powered by Vision Transformers (ViTs)—a state-of-the-art deep learning architecture that is transforming the landscape of computer vision. This model marks a significant leap in the application of artificial intelligence to precision agriculture, offering farmers across Europe a tool to identify and respond to pest threats more efficiently and sustainably. Vision Transformers, originally proposed by researchers at Google, differ from traditional convolutional neural networks (CNNs) by leveraging mechanisms known as self-attention. Rather than analyzing visual data in small local patches (as CNNs do), ViTs process the entire image as a sequence of patches, much like how natural language processing models handle text. This allows the model to capture global context at an early stage, resulting in improved performance on complex visual recognition tasks such as pest identification, where subtle inter-class variations can significantly affect outcomes.
The Queen Mary research team trained their model using an extensive dataset comprising over 80,000 images, painstakingly gathered from peer-reviewed literature, open-access agricultural databases, and scientific repositories. The resulting model is capable of detecting and classifying 80 distinct classes of pests that attack key European and global crops such as apple, cashew, cassava, cotton, maize, mango, rice, sugarcane, tomato, and wheat. These crops form the backbone of both smallholder and industrial farming systems, and improved pest detection has the potential to significantly mitigate economic losses.
In addition to these crop-specific pests, the model has been designed to identify broader signs of pest infestation and related agricultural diseases. This includes challenging categories such as weed infestations, brown spot, common rust, flag smut, fruit fly, gray leaf spot, leaf curl, smut, red cotton bug, tungro, and wilt. The inclusion of these classes enhances the model’s utility in real-world agricultural settings, where early signs of disease or infestation often overlap with multiple causes.
One of the most promising aspects of this research is its commitment to accessibility and real-world impact. The trained Vision Transformer model is being integrated into a mobile application specifically designed for use by farmers and agricultural workers. With a simple smartphone camera, users will be able to capture images of suspected pest infestations and receive on-the-spot identification and guidance. This mobile-first approach is particularly valuable in rural and semi-rural areas where access to expert agronomists may be limited.
The potential implications for the European farming community are substantial. With climate change contributing to shifts in pest migration and the emergence of new pathogens, traditional pest control methods are increasingly inadequate. This AI-powered solution empowers farmers to adopt more targeted and timely interventions, reducing the need for indiscriminate pesticide use and helping to protect the health of both crops and ecosystems. Moreover, by reducing yield loss and input costs, such technologies could contribute to improved food security and economic resilience in European agriculture. For policy makers and stakeholders in the EU’s Common Agricultural Policy (CAP), tools like the pest classification model developed at Queen Mary University represent a critical step toward modern, sustainable farming that leverages digital innovation.
In sum, the Multimedia and Vision Research Group’s work is not just a technological achievement—it is a practical response to one of agriculture’s most urgent threats. By harnessing the power of Vision Transformers, they are delivering intelligent, scalable solutions that promise to reshape pest management in Europe and beyond. As the farming community moves toward a more data-driven future, such research stands at the forefront of digital transformation in agriculture.
This research has been supported in part by the AgriDataValue project, funded by the European Union under the Horizon Europe programme (Grant Agreement No. 101086416). The Multimedia and Vision Research Group (MMV) at Queen Mary University of London, as a project partner, acknowledges the critical role of AgriDataValue in fostering data-driven innovation for sustainable agriculture. The development of the Vision Transformer-based pest classification model aligns with AgriDataValue’s broader goals of enabling smart, interoperable, and AI-enabled agricultural solutions across Europe.
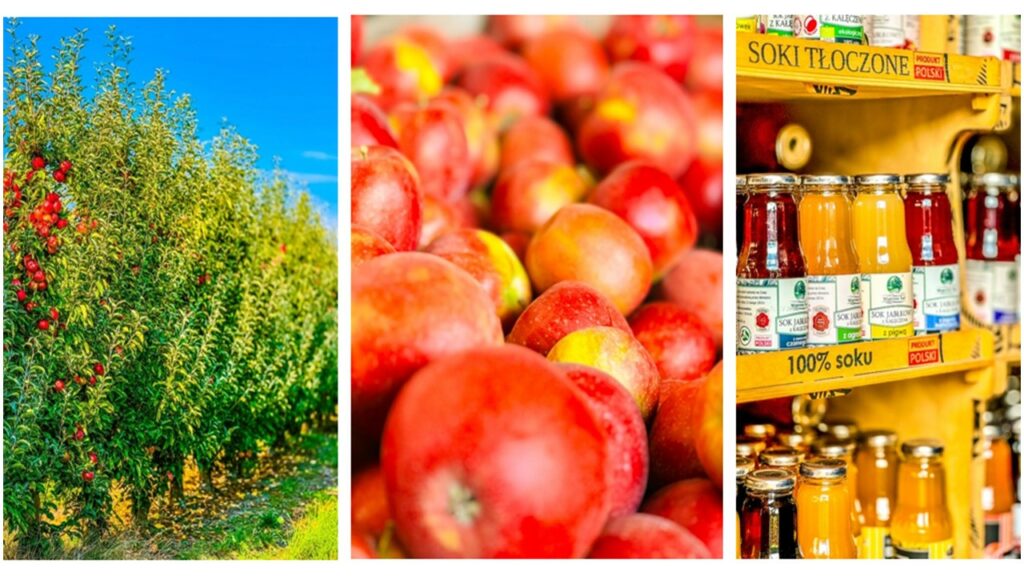
Did you know that the apple is the symbol of the current Polish Presidency of the Council of the European Union?
Poland stands at the forefront of apple cultivation in Europe, boasting impressive statistics that highlight its significance in the industry:
• 150,000 hectares of apple orchards make Poland the largest apple-growing country in the EU • Annual apple production reaches 4 million tonnes • Over 80,500 orchards, the vast majority of them are family-owned • 50–70% of the harvest is processed, especially into juices and concentrates.
In 2023, Poland was the second-largest apple exporter in Europe and seventh globally, with 817,000 tonnes of apples valued at nearly €398 million, marking a 32% increase from the previous year. Polish apples go primarily to the markets of EU countries, especially Germany, Romania, Spain, Sweden, the Netherlands and France. Among non-EU countries importing Polish apples are: Egypt, Kazakhstan, India, Saudi Arabia and the United Arab Emirates.
Apple cultivation in Poland has a long and rich tradition – dating back to medieval times, when apple trees were grown in monastery gardens and near royal courts. Over the centuries, apples have become not only an economic driver but also a cultural symbol of Polish agriculture. Today, Poland boasts a remarkable diversity of apple cultivars, with several dozen varieties officially registered. Popular varieties include Idared, Jonagold, Champion, Ligol, Golden Delicious, Red Delicious, Gala, Gloster, Lobo, and Cortland.
As part of the AgriDataValues project, one of our pilots – „Wiatrowy Sad” is a medium-sized, family-owned apple orchard in Poland. With the help of innovative smart farming solutions developed within the project, this orchard is looking forward to increasing production efficiency, reducing input costs, and adapting more effectively to climate and market challenges.
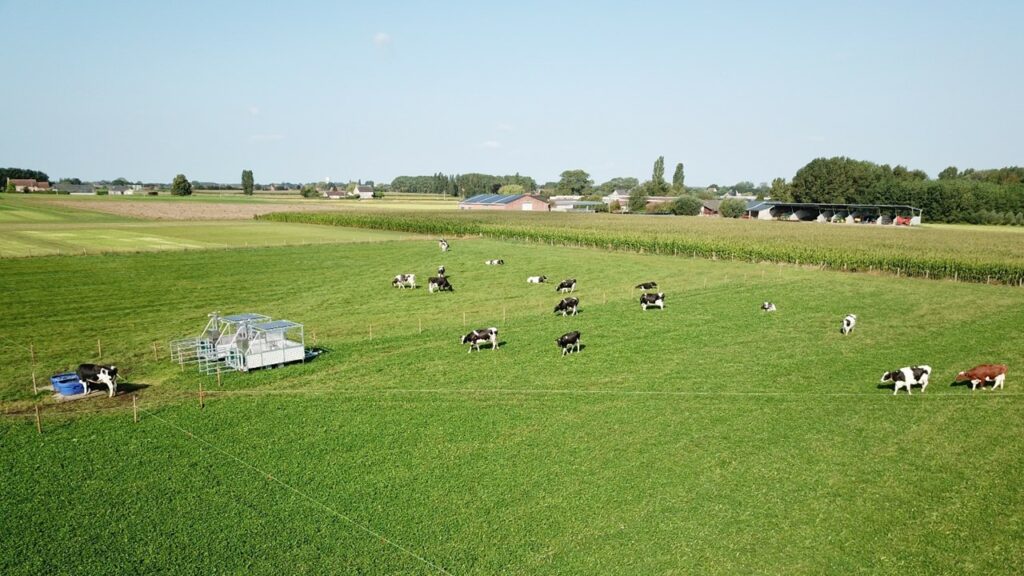
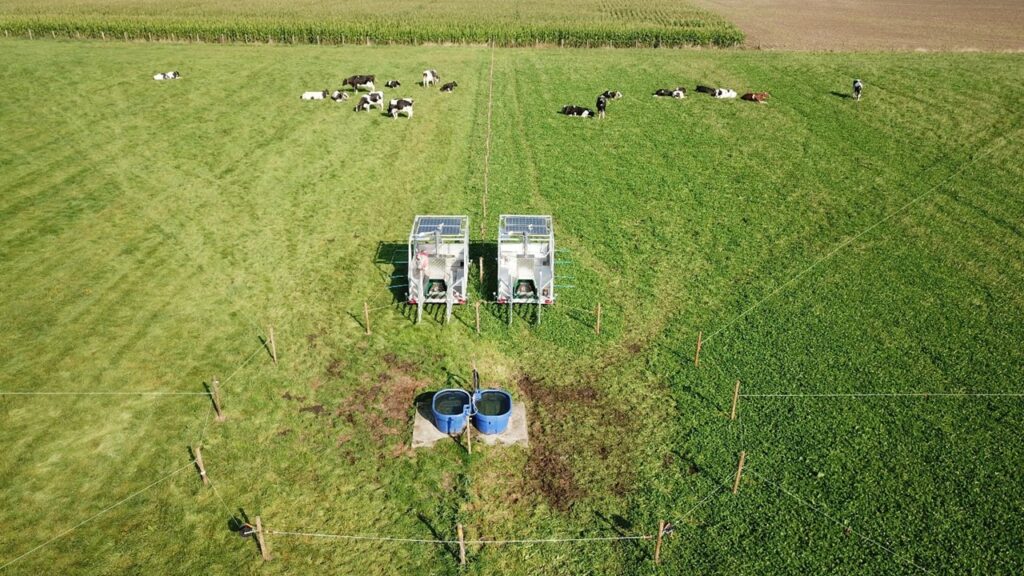
Within the AgriDataValue project, the ILVO pilot sites are constantly gathering data. One use case that ILVO is working on concerns reducing greenhouse gas emissions. In case you don’t know, cows produce a lot of methane. How? By burping it up all the time! Cows’ digestive system is designed to digest fibrous feeds such as grass and other plants, something we as humans can’t.
However, it comes with a side effect: cows are burping methane formed as a by-product of the breakdown of fibers in the rumen. As methane is a strong greenhouse gas, the cattle sector is searching for ways to reduce the amount of methane produced by cows. However, measuring methane production from cows is not an easy task, as it requires sophisticated measuring equipment. Regularly performing measurements on commercial farms to check on methane production and the effect of reduction measures is hence impossible. Therefore, an important question arises: Can we predict methane emissions from information we know?
To answer this question, we need to look at the information we have available. What if we use the cow’s general information, such as her age, lactation stage, parity, milk production, and the nutritive values of the feed she eats? For the human eye it is almost impossible to see connections and patterns between these data and methane emissions data. Therefore, we need external help. Luckily, machine learning models might just be the solution we need.
The AgriDataValue platform currently being developed allows to provide these data to train machine learning models capable of predicting the methane emission of a cow. Of course, to train these models, we do need to know the emission data from the cows in these training data. As such, at the beginning of April, ILVO starts yet another trial to look for more ways to reduce enteric methane emissions in a grazing context, and thus, data gathering continues.
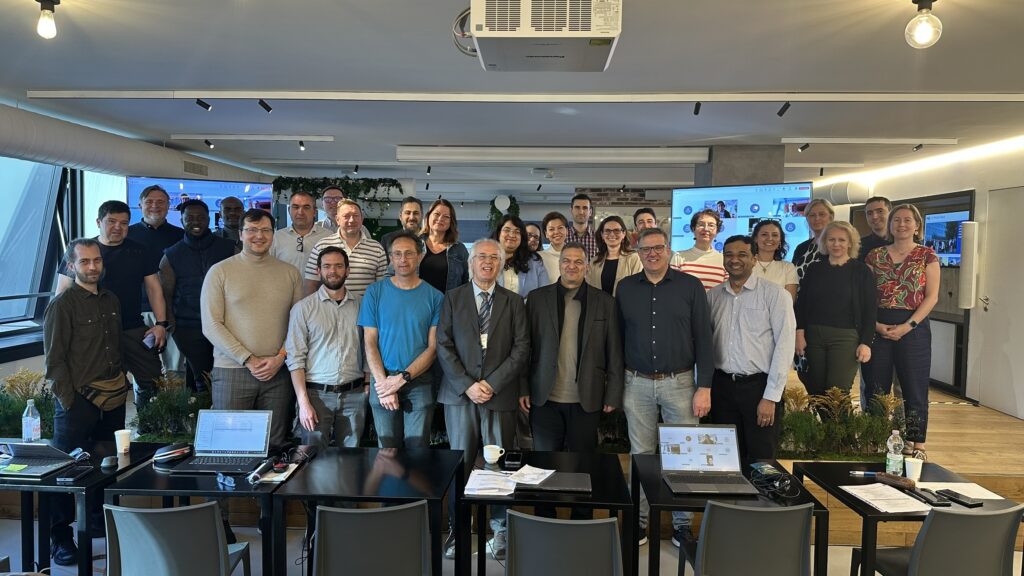
The partners of the AgriDataValue project have gathered to address project related issues in a two-day hybrid meeting. The fifth plenary meeting hosted by Almaviva, in Milan, Italy on the 3rd and 4th of April 2025.
The 2-day plenary meeting featured a number of technical and co-creation sessions, in which a fruitful discussion took place among the partners of the consortium. The consortium reviewed the progress on all work packages and had the chance to address development issues. The partners presented the results achieved so far and the next steps towards the successful delivery of the AgriDataValue project.
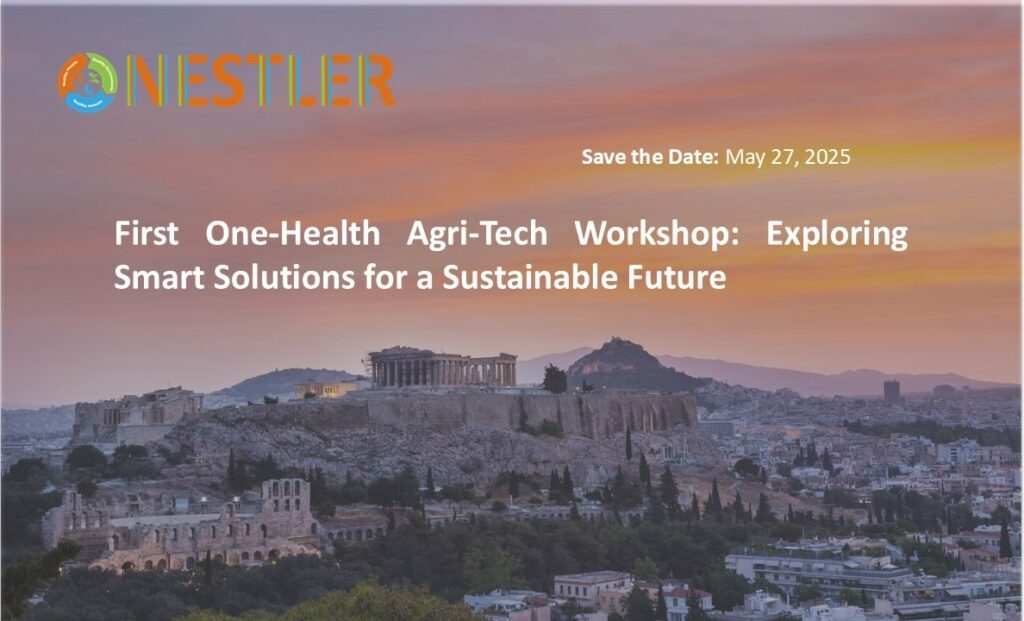
The NESTLER EU Project is pleased to invite researchers, industry professionals, and policymakers to its 2025 event in Athens, Greece. This event will serve as a collaborative platform for discussing innovative agricultural technologies and sustainability strategies that align with the Farm to Fork objectives of the European Green Deal.
NESTLER, funded under Horizon Europe, focuses on integrating advanced technologies—such as remote sensing, AI-driven analytics, and circular economy principles—into agri-tech solutions to enhance food security and environmental sustainability. This event aims to bring together stakeholders from relevant EU-funded projects, including AGRIDATAVALUE and GEORGIA, to explore synergies and share best practices.
Key Topics:
One-Health Sustainability in Agri-Food Systems: Enhancing food security and environmental health through cross-sectoral collaboration.
AI-Driven Agricultural Insights: Machine learning applications for crop monitoring, predictive analytics, and decision support systems.
Remote Sensing & IoT for Smart Farming: Integration of satellite data, UAV imagery, and IoT sensors for optimized agricultural practices.
Circular Economy in Agriculture: Sustainable insect protein production, frass fertilizer applications, and waste valorization.
Resilient Supply Chains & Economic Risk Assessment: Digital tools for monitoring and mitigating supply chain disruptions in agriculture.
EU-Africa One-Health Collaboration: Strengthening international partnerships for sustainable and resilient farming practices.
Satellite Technologies for Agricultural Monitoring:Leveraging satellite data to enhance crop yield predictions and climate resilience (AGRIDATAVALUE project).
Who Should Attend?
This event is designed for:
Researchers and academics in agri-tech and sustainability.
Representatives of EU-funded projects with a focus on smart agriculture.
Agribusiness professionals and technology providers.
Policymakers and regulatory bodies.
NGOs and industry stakeholders engaged in food security and circular economy initiatives.
Call for Contributions
Participants are encouraged to submit proposals for short presentations, posters, or panel discussions. Submissions should align with the key themes of the event and present innovative research findings, pilot studies, or technological advancements.
Submission Deadline: March 30, 2025 Notification of Acceptance: April 15, 2025
How to Apply
To submit your contribution, please send an abstract (max. 300 words) to cfp@nestler-project.eu with the subject line “NESTLER Event 2025 Submission”.
Join us in Athens to drive the future of sustainable agri-tech solutions and foster collaboration across European research initiative.
The agricultural sector is facing significant challenges in managing and exchanging data across diverse systems and stakeholders. With the proliferation of sensors, weather data, farming machinery, and other digital tools, there is an increasing need for standardized methods to ensure that agricultural data can be exchanged seamlessly and with a clear, consistent meaning. The AgriDataValue project is at the forefront of tackling this issue, focusing on developing data models and enhancing semantic interoperability within the agriculture domain.
Data Models: The Backbone of Standardized Agricultural Data
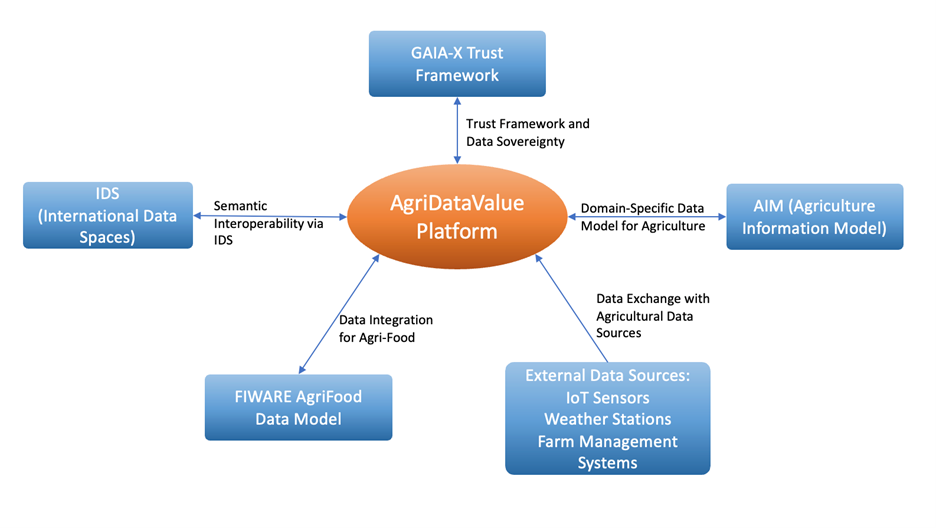
In the context of the AgriDataValue project, data models play a crucial role. These models provide a structured and standardized way of organizing agricultural data, making it easier for stakeholders to understand, share, and use. By establishing clear frameworks for data representation, AgriDataValue helps ensure that agricultural data from various sources—ranging from IoT sensors and weather stations to farm management systems—can be efficiently integrated and analyzed (W3C, 2014). The AgriDataValue platform serves as the central hub in the ecosystem, facilitating seamless data exchange and interoperability between various components. The diagram below illustrates the flow of data and interactions between the AgriDataValue platform and external data sources, such as IoT sensors, weather stations, and farm management systems, as well as the integration of standards like IDS, GAIA-X, AIM, and FIWARE. (Figure 1)
Figure 1: Data Flow and Semantic Interoperability Between Key Components
Semantic Interoperability: Ensuring Consistent Data Meaning
However, it is not enough just to organize data; we also need to ensure that the meaning of the data is preserved and understood across different systems and platforms. This is where semantic interoperability comes into play. Semantic interoperability ensures that data exchanged between different systems is not only compatible but also retains its intended meaning (International Data Spaces Association, 2020). AgriDataValue achieves this by leveraging the International Data Spaces (IDS) standard and the GAIA-X Trust Framework, both of which provide robust guidelines for data exchange in the agriculture sector (GAIA-X, 2021). By aligning with the Agriculture Information Model (AIM) from the DEMETER project, AgriDataValue strengthens the way data is represented and exchanged within the sector (DEMETER Project, 2020). The IDS framework and its reference architecture, IDS-RAM, facilitate the integration of various systems and ensure that data can be exchanged without ambiguity. AgriDataValue adheres to the IDS-RAM, which offers a comprehensive view of data structures, concepts, and vocabularies, allowing for consistent semantic interoperability across different platforms (International Data Spaces Association, 2020).
Integrating IDS and AIM for Sector-Specific Solutions
One of the key innovations of the AgriDataValue project is the integration of IDS Information Model and the Agriculture Information Model (AIM). The IDS model is domain-agnostic, providing a general framework that can be applied to a wide range of industries, while AIM is specifically designed to address the unique needs of the agriculture sector (DEMETER Project, 2020). This integration allows AgriDataValue to provide both broad industry-wide data structures and domain-specific agricultural data elements. For example, while the IDS Information Model includes concepts such as data assets, contracts, and participants, the AIM brings in agricultural-specific elements like AgriParcel, Crop, Intervention, and Pest (W3C, 2012). This combination ensures that AgriDataValue can cater to the specific needs of the agricultural industry while remaining adaptable to cross-industry applications (FIWARE Foundation, 2020). The Agriculture Information Model (AIM), developed under the DEMETER project, is a comprehensive framework designed to facilitate semantic interoperability in agriculture. The model is publicly accessible and available under the Creative Commons Attribution 4.0 License, which promotes open and transparent data exchange (DEMETER Project, 2020). AIM is structured into several modules, each addressing specific agricultural domains like crop management, animal husbandry, and intervention systems (W3C, 2014). These modules are represented in standard OWL (Ontology Web Language) and RDF (Resource Description Framework) formats, ensuring compatibility with other data models and facilitating integration with various systems across the agriculture sector (W3C, 2012).
Enhancing Data Sovereignty and Security with GAIA-X
Another key element of the AgriDataValue project is its commitment to data sovereignty, security, and privacy. The GAIA-X Trust Framework plays a central role in this regard. By adhering to GAIA-X’s technical and organizational guidelines, AgriDataValue ensures that agricultural data is handled securely, preserving user privacy and complying with data protection regulations (GAIA-X, 2021). This focus on trust and data security is essential for fostering confidence among data providers and consumers in the AgriDataValue ecosystem. The project implements mechanisms such as data anonymization and access control, ensuring that sensitive agricultural data is protected while still enabling meaningful insights and analysis (International Data Spaces Association, 2020).
The Road Ahead: Extending and Evolving the AgriDataValue Model
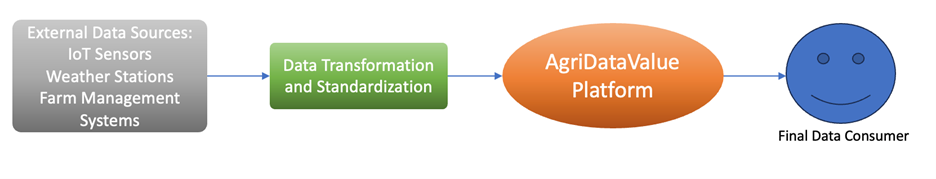
As the AgriDataValue project progresses, it remains focused on creating a flexible, extensible data model. This model is designed to evolve as new technologies, data sources, and user needs emerge within the agricultural sector (FIWARE Foundation, 2020). In the coming stages, AgriDataValue plans to expand its semantic interoperability mechanisms by integrating other data models and frameworks. These include FIWARE AgriFood Data Model, which further enhances interoperability in the agri-food sector, and other industry-specific vocabularies that will continue to improve the integration of agricultural data (DEMETER Project, 2020). The integration of such models will ensure that AgriDataValue can support the dynamic, evolving nature of agriculture and continue to provide value to stakeholders in the sector. Whether it’s enhancing precision farming, improving resource management, or supporting decision-making at the policy level, AgriDataValue is well-positioned to drive the future of agricultural data interoperability (Atzori et al., 2017). The diagram below illustrates the flow of data from external sources such as IoT sensors, weather stations, and farm management systems, through data transformation and standardization, to the AgriDataValue platform, and finally to end-users like farmers and policymakers. This process ensures that agricultural data is standardized and integrated for actionable insights and effective decision-making. (Figure 2)
Figure 2: Data Flow Between Systems: Collection, Transformation, and Final Consumption
Conclusion
The AgriDataValue project stands as a key initiative in promoting data interoperability in the agricultural sector. By combining robust data models, semantic interoperability frameworks, and a commitment to data security, AgriDataValue is helping to pave the way for more efficient, transparent, and data-driven agricultural practices. As the project continues to grow, its impact on the sector will only become more profound, enabling farmers, policymakers, and businesses to make informed, data-driven decisions for a sustainable future (Stojanovic & Milinkovic, 2019).
References
1) DEMETER Project. (2020). Agriculture Information Model (AIM) Overview. Retrieved from https://www.demeter-h2020.eu 2) GAIA-X. (2021). GAIA-X Trust Framework. Retrieved from https://www.gaia-x.eu 3) FIWARE Foundation. (2020). FIWARE AgriFood Data Model. Retrieved from https://www.fiware.org 4) W3C. (2014). RDF 1.1 Primer. W3C Recommendation. Retrieved from https://www.w3.org/TR/rdf11-primer/ 5) W3C. (2012). OWL 2 Web Ontology Language Document Overview. W3C Recommendation. Retrieved from https://www.w3.org/TR/owl2-overview/ 6) Atzori, L., Iera, A., & Morabito, G. (2017). The Internet of Things: A survey. Computer Networks, 54(15), 2787-2805. https://doi.org/10.1016/j.comnet.2010.05.009 7) Stojanovic, J., & Milinkovic, D. (2019). Standards and Frameworks for Agricultural Data Integration. Sensors, 19(2), 289. https://doi.org/10.3390/s19020289 8) International Data Spaces Association. (2020). International Data Spaces Reference Architecture Model (IDS-RAM). Retrieved from https://www.internationaldataspaces.org
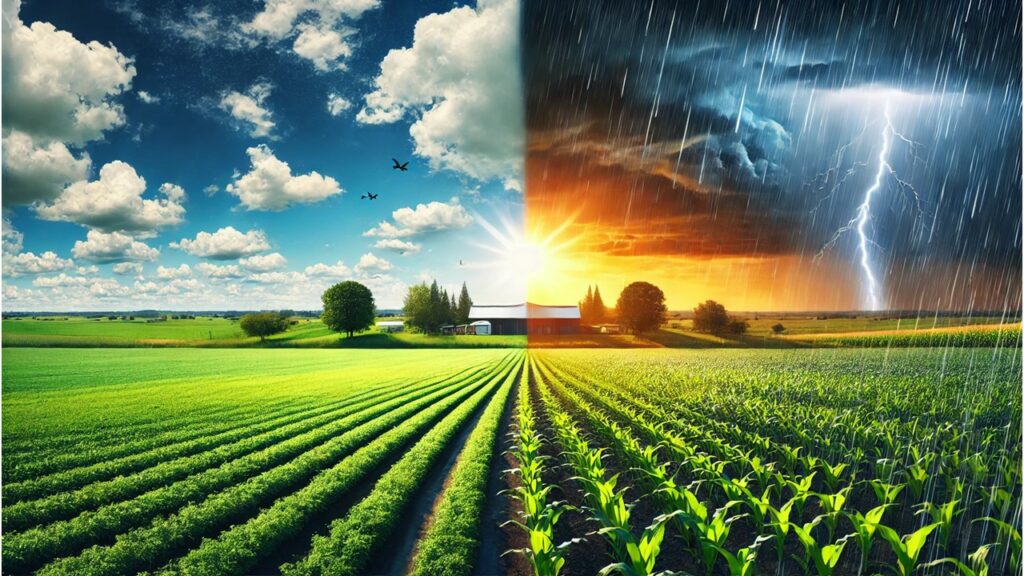
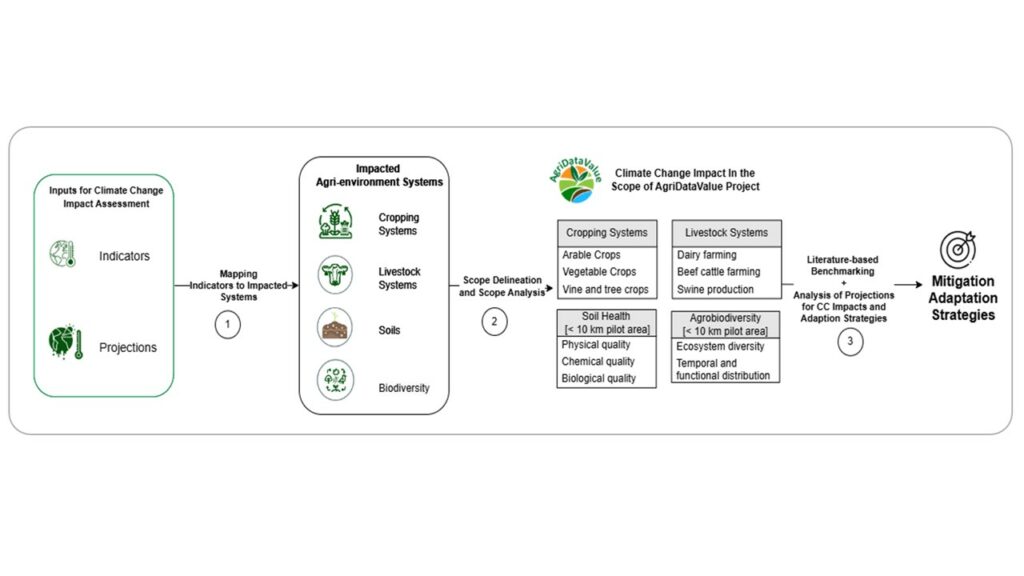
The weather is getting wilder, the seasons less predictable, and farmers are feeling the heat—literally! Climate change is reality, it isn’t some distant threat; it’s here, reshaping our soils, crops, livestock and biodiversity. What does the future hold for my farm and other agri-environmental systems near and far, in the face of the changing climates? This is the pressing worry and question of farming communities in Europe and globally today. One effective approach to addressing such an important question on the impact of climate change challenges in agriculture is co-designing measures that enhance resilience through both long-term mitigation as well as short-term adaptations.
Co-designing for resilience
In the AgriDataValue project, assessing the impact of climate change in the agriculture systems is one of the main addressed topics. The AgriDataValue Consortium is composed by a multi-stakeholder partnership that comprise agricultural practitioners (farmers, farming-companies, and cooperatives), CAP–agencies (Common Agricultural Policy) paying agencies, and technical technology partners working in the data-driven sectors, for a total of 30 partners from 14 European countries, and 23 pilots across nine EU countries. The adopted approach to address Climate change is to combine both the historical trends and the future projections of key climate change indicators, to arrive at the impact of climate change in biodiversity, soil health, cropping systems and animal husbandry. The ultimate target is to contribute to the sustainability of the European Agri-environmental systems (AES) today and in the future through developing adaptation and mitigation strategies.
Countries and pilot agricultural Systems
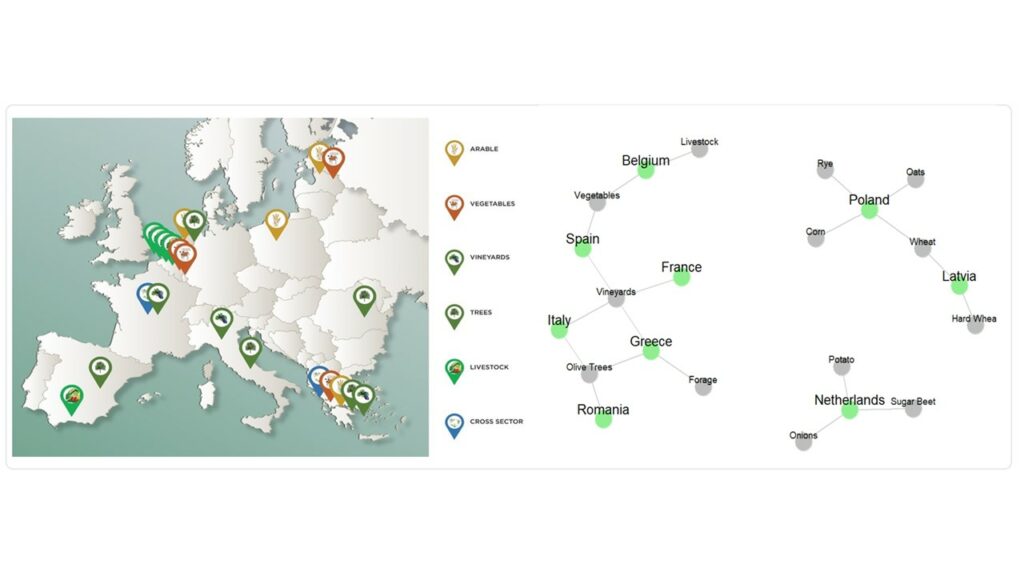
Agricultural systems in Europe are highly diverse and complex, shaped by a wide range of plant and animal commodities, as well as the interactions between climate and management practices across various environments. Key components of these systems, considered for assessing climate change impacts, include cropping systems, livestock systems, soil health, and agro-biodiversity. These components encompass a variety of crops such as arable crops, vegetables, and trees found in vineyards and olive groves, as well as livestock and cross-cutting issues like soil quality and biodiversity. For instance, in Poland, the focus is on arable crops such as wheat, corn, rye, and oats, while in the Netherlands, the emphasis is on potatoes, onions, and sugar beets. Latvia centers on wheat and hard wheat, whereas Greece focuses on forage, vineyards, and olive trees. Belgium is known for its vegetables and livestock, Spain for its vegetables and vineyards, and France for its vineyards. Italy’s agricultural system assessment includes both vineyards and olive trees, while in Romania it is olive trees.
Climate change indicators and their projections
Indicators of climatic and meteorological conditions constitute a vital category of tools used to assess and understand climate characteristics and changes, as well as their impacts on our agri-environment and societies. These indicators capture a variety of parameters related to climate and weather conditions. Their utility lies in their ability to provide valuable information on long-term climate trends, seasonal variations, as well as extreme weather events. These data enable the assessment of climate impacts on ecosystems, natural resources, human activities, and infrastructure. Additionally, they serve as a basis for developing adaptation and mitigation strategies against climate change, as well as policies for sustainable environmental management. Some of the selected key indicators include metrics such as land cover classification, land surface temperature, evapotranspiration, soil composition, the normalized difference water index, and more. They serve as a baseline for understanding how agricultural systems have responded to environmental changes over time and set the foundation for future projections.
Figure 1: AgriDataValue project pilot partners (left) and their pilot agricultural systems and country-commodity network (right)
Projection of indicators is done building upon these historical indicators using CMIP6 models (1) for the years 2030, 2050, and 2070 under two scenarios: SSP2-4.5 (2) and SSP5-8.5. These projections include indicators like air temperature, soil water storage capacity, precipitation, drought frequency, and snowfall flux, covering both short-term (2025-2030) and long-term (2030-2070) periods. Short-term projections focus on specific metrics such as near-surface air temperature, wind speed, and humidity, while the long-term forecast encompasses a broader range of 23 indicators. These projections will be downscaled to 1km and 10 km resolutions to allow us to assess their impact on Pilot’s representing diverse cropping systems and livestock husbandry practices in landscapes harbouring different ecosystems and soils, the sub-systems are targeted for assessment of the effects of climate change and tailored recommended adaptation and mitigation strategies.
Mapping indicators, impacts and coping strategies
To effectively assess the impact of climate change on agricultural systems, a detailed mapping of candidate indicators to the affected agri-environment systems is being carried out. This mapping aligns historical trends and projection of indicators with possible expected impacts supported by literature and expert elicitations on specific AES such as cropping systems, livestock systems, soil health, and biodiversity. For examples, in scenarios of increased projected temperature, established research indicates that the impact on cropping systems might include challenges related to shifts in growing seasons, water availability, and crop productivity, leading to changes in crop types, planting schedules, and overall agricultural practices. Livestock systems will be affected by increased heat stress, altering feed availability and quality, and affecting animal health, growth rates, and reproduction. Soil health, a crucial foundation for sustainable agriculture, could degrade due to erosion, nutrient depletion, and changes in moisture retention, threatening long-term productivity. Agrobiodiversity, which supports the resilience of agricultural ecosystems, may decline as climate change alters habitats, reduces species diversity, and disrupts the balance of organisms essential for pest control, pollination, and nutrient cycling. Together, these impacts highlight the need for adaptive strategies to protect the sustainability and productivity of agricultural systems.
The major outcome of the conducted study – still being in progress – based on such projected impacts, is a set of recommendations for both short- and long-term actions. Taking the scenario of projected increased temperature as example indicator, the literature on climate adaptation and mitigation strategies offers variety of approaches. Short-term adaptation strategies may include adjusting planting schedules to account for shifts in growing seasons and implementing better water management practices, such as irrigation systems or rainwater harvesting. Farmers may also adopt minimum or zero tillage practices, which help maintain soil moisture, prevent erosion, and improve soil structure, particularly in regions facing drought or heavy rainfall. Additionally, diversifying crop varieties that are more heat- or drought-tolerant could help farmers cope with changing climatic conditions. Long-term mitigation strategies could involve adopting agroforestry practices, where trees are integrated into agricultural landscapes to sequester carbon, enhance biodiversity, and improve soil health. Sustainable land management practices that improve soil organic matter and reduce chemical fertilizer use will help mitigate climate change while making farms more resilient. Lastly, shifting to agroecological farming systems, such as intercropping or organic farming, could improve farm resilience to changing environmental conditions while maintaining sustainability.
Road map to resilience
The initial results of the climate change impact assessment on agriculture systems that we produced so far, are starting to provide valuable insights into how the systems can prepare for a changing climate, with specific strategies tailored to the needs of farmers across Europe. By using climate projections, historical data, and expert insights, we can develop adaptation and mitigation strategies that are both practical and scalable. As we move forward, the integration of climate indicators into decision-making tools will help farmers, policymakers, and researchers make informed choices. This collaboration will ensure that farmers across Europe are ready for the challenges ahead, building climate-resilient agricultural systems that can thrive in the face of uncertainty. Through continuous monitoring and the active engagement of farming communities, both the short- and long-term strategies would remain effective to mitigate and enable the systems adapt in the face of evolving climate challenges while ensuring environmental sustainability.
Figure 2. A roadmap for assessing the impact of climate change on European agricultural systems by analysing historical trends and projections of key indicators to develop recommended adaptation and mitigation strategies for resilience
(1) The Coupled Model Intercomparison Project (CMIP) is a global scientific initiative designed to improve the understanding of climate change by comparing different climate models. It provides a framework to simulate past, present, and future climate conditions based on various factors such as greenhouse gas emissions and land use changes. The latest phase, CMIP6, integrates data from multiple climate models worldwide to generate future projections, helping scientists and policymakers assess potential climate impacts.
(2) Within CMIP6, Shared Socioeconomic Pathways (SSP) are scenarios that describe different possible futures based on socioeconomic developments and greenhouse gas emissions. These pathways help researchers explore how human activities might influence climate change. SSP2-4.5 represents a future where moderate efforts are made to reduce emissions, leading to a balanced climate response, while SSP5-8.5 assumes high emissions with minimal climate policies, resulting in more extreme warming and environmental changes. These projections provide valuable insights for developing climate adaptation and mitigation strategies.
Agriculture is rapidly becoming digitalised, with stakeholders increasingly relying on technologies such as IoT sensors, farm management systems, remote sensing, and precision farming equipment. Within this digital transformation, dataspaces have emerged as crucial frameworks enabling secure, structured, and regulated data exchange among stakeholders such as farmers, agribusinesses, technology providers, policymakers, and researchers. By facilitating transparent collaboration, dataspaces enhance the potential for innovation and collective value creation, allowing stakeholders to integrate fragmented agricultural data and drive significant productivity and sustainability improvements across the sector.
However, despite enabling robust data exchange, agricultural dataspaces currently lack structured methodologies to assess the value of the data being shared and exchanged. Although the infrastructure for secure and interoperable data sharing is growing, the assessment and transparent quantification of data’s inherent value remain missing. This gap prevents data producers and consumers from fully recognising, quantifying, and realising the economic potential of their data assets. Data producers may underestimate their contributions, while consumers may struggle to accurately assess the benefits or justify the costs associated with data access.
Acknowledging the significance of this issue, the AgriDataValue project will conduct targeted stakeholder interviews within its partners to understand how agricultural stakeholders currently perceive, interpret, and articulate the value of their data. These stakeholder insights will provide critical input and context to support and inform ongoing research efforts in this domain. Specifically, these insights will help researchers better understand stakeholder perspectives, identify gaps, and inform the development of robust, actionable data value assessment methodologies tailored to agricultural contexts. Incorporating effective data value assessment methodologies into agricultural dataspaces can enhance interactions between data producers and data consumers. By evidencing data value, stakeholders can better engage in data-sharing practices, improve trust, and benefit from fairer and more productive collaboration. Furthermore, robust assessment frameworks would stimulate greater participation in agricultural dataspaces, contributing to the growth and sustainability of a thriving agricultural data economy.
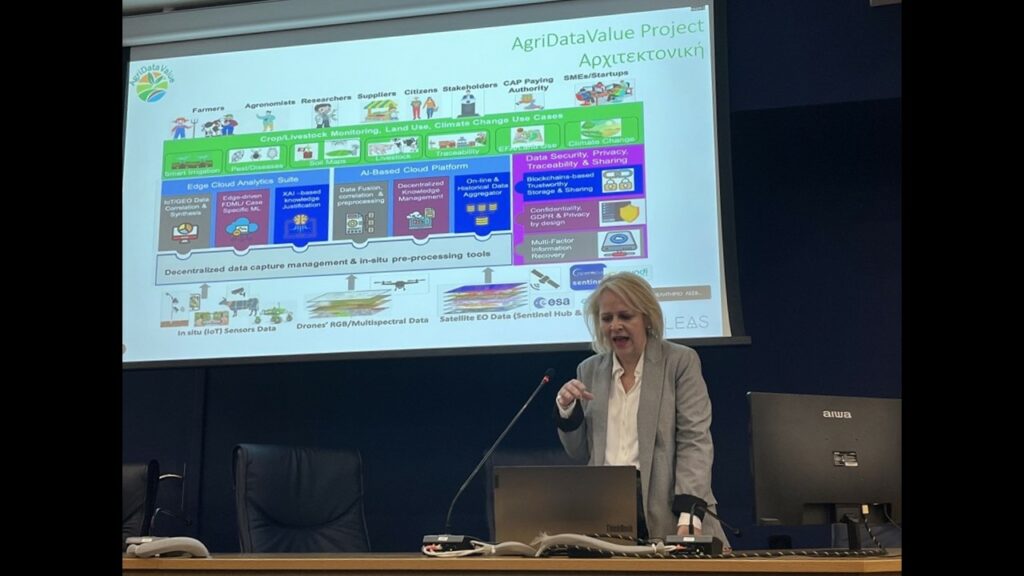
On Wednesday, February 26, Vicky Inglezou, Project Manager of the NILEAS Producers Group, presented the AgriDataValue Project at the informative Workshop on Carbon Farming, entitled: “Prospects & Challenges of Carbon Farming”, within the framework of the Erasmus+ Carbon Farming HUB program.
Held in Lesvos Chamber (Mytilene), Ms. Inglezou highlighted the AgriDataValue Project’s mission to enhance agricultural digital transformation in Europe. The project aims to create a digital platform that integrates real-time data from ground sensors and agrometeorological stations with multispectral images from satellites and drones, supporting machine learning models and smart agriculture applications.
In her presentation on olive cultivation, she emphasized smart tools that can manage risks and tackle climate challenges. She highlighted NILEAS’ three pilot use cases: disease forecasting, anti-frost control, and pest management for olive fruit flies. She concluded with the benefits of digital transformation in agriculture, including environmental impact, contribution to climate change mitigation, biodiversity preservation, improved food security, access to nutritious food, affordability, fair economic returns for producers, and promotion of fair trade.